54
Association Between Ultra-Processed Food Consumption and Prostate Cancer Risk: Evidence From NHANES 2003–2023
Based on findings reported by Scott H, et al. Am J Med. 2026;doi:10.1016/j.amjmed.2026.07.043.
Introduction and Clinical Background
Ultra-processed foods (UPFs)—encompassing packaged snacks, breakfast cereals, frozen prepared meals, fast food, industrially processed meats, and sugar-sweetened beverages—now comprise the majority of caloric intake in the US. Characterized by high concentrations of added sugars, refined fats, and chemical additives such as artificial flavorings and preservatives, UPFs have been shown to alter the gut microbiome, disturb metabolic pathways, and induce systemic oxidative stress and inflammation.
Highlighting the scale of dietary exposure and its health implications, senior author Charles H. Hennekens, MD, FACPM, the first Sir Richard Doll Professor of Medicine & Preventive Medicine at Florida Atlantic University’s Schmidt College of Medicine, noted:
While prior research has correlated heavy UPF intake with increased risks of obesity, cardiometabolic disease—including a 47% increased risk of myocardial infarction or stroke—and elevated all-cause and cancer-specific mortality among cancer survivors, empirical data regarding its relationship with prostate cancer remained scarce. Because prostate cancer is the second leading cause of cancer mortality among American men behind lung cancer, the authors investigated this potential oncologic association.
Dr. Hennekens commented on the rationale:
Study Design and Cohort Classification
Investigators evaluated cross-sectional data collected from 17,024 adult men participating in the National Health and Nutrition Examination Survey (NHANES) between 2003 and 2023. Dietary exposure was quantified via two 24-hour dietary recalls and classified using the validated NOVA food classification framework according to the proportion of daily energy derived from UPFs. Prostate cancer occurrence was ascertained through standardized participant self-report.
Table 1. Study Population, Dietary Classification, and Methodological Parameters
| Parameter | Study Specification |
| Data Source & Cohort | National Health and Nutrition Examination Survey (NHANES), 2003–2023 ($N = 17,024$ adult men) |
| Dietary Assessment Tool | Two 24-hour dietary recall interviews |
| Classification Framework | NOVA classification system (categorized by extent and purpose of food processing) |
| Exposure Stratification | * Quartile 1 (Lowest): <20.45% of daily energy intake from UPFs * Quartile 2 & 3 (Intermediate): 20.45% to 43.87% of daily energy intake from UPFs * Quartile 4 (Highest): >43.87% of daily energy intake from UPFs |
| Outcome Ascertainment | Validated self-reported diagnosis of prostate cancer |
| Multivariable Covariates | Age, race, ethnicity, cigarette smoking history, and socioeconomic/poverty status |
Risk Estimates and Statistical Analysis
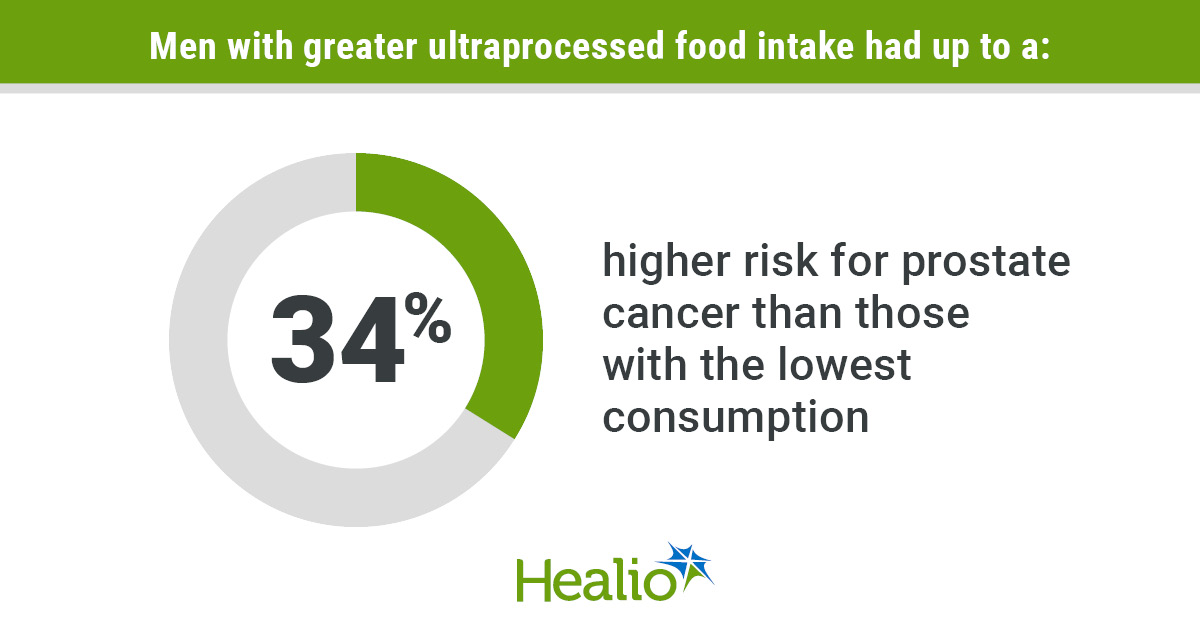
Across both unadjusted and multivariable-adjusted analyses, elevated intake of ultra-processed food showed a consistent association with a 24% to 34% increased risk of prostate cancer compared to baseline intake.
In crude evaluations, men consuming above the lowest quartile (Quartiles 2, 3, and 4 combined) had a 29% greater risk of prostate cancer compared with those in the lowest intake quartile. Men in the combined upper two quartiles (Quartiles 3 and 4) demonstrated a 30% increased risk. After adjusting for age, race, ethnicity, smoking status, and poverty level, men in the combined upper three quartiles had a 27% increased risk, and those in the upper two quartiles exhibited a 31% higher risk. The comparison between the highest and lowest individual quartiles indicated a 31% to 34% elevated risk, though this specific comparison did not achieve statistical significance due to the limited number of isolated events.
Table 2. Unadjusted and Multivariable-Adjusted Relative Risks of Prostate Cancer by UPF Exposure
| UPF Exposure Tier | Crude Relative Risk (RR) | 90% or 95% Confidence Interval (CI) | Adjusted Relative Risk (aHR / aRR)* | 90% Confidence Interval (CI) |
| Quartile 1 (Lowest) | 1.00 (Reference) | — | 1.00 (Reference) | — |
| Quartiles 2, 3, & 4 Combined vs Q1 | 1.29 | 90% CI, 1.03–1.62 | 1.27 | 90% CI, 1.01–1.60 |
| Quartiles 3 & 4 Combined vs Q1 | 1.30 | 95% CI, 1.03–1.65 | 1.31 | 90% CI, 1.02–1.68 |
| Quartile 4 (Highest) vs Q1 | 1.31 | 90% CI, 0.96–1.78 | 1.34 | 90% CI, 0.96–1.85 |
*Adjusted for age, race, ethnicity, smoking history, and poverty status.
Dr. Hennekens noted the consistency across tiers:
Biological Mechanisms and Clinical Guidance
The primary biological pathway hypothesized to mediate this oncologic risk is chronic, systemic low-grade inflammation, which Dr. Hennekens termed:
Addressing the high prevalence of obesity in the United States—where nearly 42% of the adult population is classified as obese—Dr. Hennekens emphasized broad therapeutic counseling:
While existing data do not establish whether dietary restriction halts progression or metastasis in patients with established prostate tumors, reducing UPF consumption provides substantial systemic protection. Dr. Hennekens concluded: