Menstrual Cycle Linked to Changes in Insulin Sensitivity and Glucose Control in Women With Type 1 Diabetes Using Automated Insulin Delivery
1-minute summary
A real-world observational study published in Diabetes Care found that insulin requirements, glucose levels, carbohydrate intake and insulin sensitivity varied systematically across menstrual-cycle phases in menstruating adults with type 1 diabetes (T1D) using automated insulin delivery (AID) systems.
The study analyzed data from 77 participants contributing 380 menstrual cycles. Overall, insulin sensitivity was greatest during the early follicular phase and declined during the luteal phase, reaching its lowest level around the midluteal phase.
Correspondingly, glycemic control worsened during the luteal phase. Time in range (TIR; glucose 70–180 mg/dL) declined from 78.9% during the early follicular phase to 75.7% during the late luteal phase. Time in tight range (70–140 mg/dL) showed a similar decline.
At the population level, modeled insulin sensitivity was approximately 2.6% above the population mean during the early follicular phase and approximately 2.6% below the mean during the midluteal phase.
However, there was considerable variation between individuals. Approximately 84.7% of participants demonstrated the same overall direction of change—higher insulin sensitivity during the follicular phase followed by lower sensitivity during the midluteal phase—while others showed different patterns.
The researchers suggest that future AID algorithms may need to account for menstrual-cycle-related physiological changes rather than relying exclusively on fixed learning periods.
Why this matters
Menstrual-cycle hormones can influence insulin sensitivity and glucose regulation. For people with T1D, even relatively modest changes in insulin sensitivity can affect insulin requirements and glucose control.
Modern AID systems continuously adjust insulin delivery based on glucose measurements, but the algorithms may not specifically incorporate predictable hormonal changes associated with the menstrual cycle.
The study suggests that menstrual-cycle phase may be an additional physiological variable that could improve individualized insulin delivery.
Importantly, the researchers also found substantial differences between individuals. Therefore, a single standardized insulin adjustment for every person at a particular menstrual-cycle phase is unlikely to work universally.
Study at a glance
| Feature | Details |
|---|---|
| Study type | Decentralized observational study using real-world data |
| Journal | Diabetes Care |
| Participants | 77 menstruating adults with T1D |
| Menstrual cycles analyzed | 380 |
| Mean age | 35.1 years |
| Diabetes technology | Automated insulin delivery systems |
| Data sources | CGM, insulin delivery, carbohydrate intake and menstrual-cycle data |
| Primary focus | Changes in insulin sensitivity across menstrual-cycle phases |
| Glucose target for TIR | 70–180 mg/dL |
| Tight-range target | 70–140 mg/dL |
| Mean overall TIR | 77.4% |
| Mean overall time in tight range | 52.9% |
| Mean total daily insulin dose | 37.3 U/day among 64 participants with insulin-dose data |
| Mean carbohydrate intake | 118.8 g/day among 61 participants with available data |
| Follow-up/data duration | Mean 4.9 menstrual cycles per participant |
| Key finding | Insulin sensitivity and glycemic control varied systematically across menstrual-cycle phases |
The participants contributed a total of approximately 10,107 days of data, with a mean of 4.9 menstrual cycles per participant.
Participant characteristics and baseline diabetes-management data
The study included menstruating adults with T1D who reported regular menstrual cycles and were using AID systems.
| Parameter | Study population |
|---|---|
| Participants | 77 |
| Mean age | 35.1 years |
| Menstrual cycles | 380 |
| Mean cycle length | 28.4 days |
| Mean cycle-length variability | 2.4 days |
| Mean TIR, 70–180 mg/dL | 77.4% |
| Mean time in tight range, 70–140 mg/dL | 52.9% |
| Participants with insulin-dose data | 64 |
| Mean total daily insulin | 37.3 U/day |
| Mean bolus insulin | 20.0 U/day |
| Mean basal insulin | 17.5 U/day |
| Participants with carbohydrate data | 61 |
| Mean carbohydrate intake | 118.8 g/day |
Both commercial and open-source AID systems were represented among participants with available device information.
What the researchers found
1. Glycemic control varied across the menstrual cycle
The investigators found a gradual change in glucose control across menstrual-cycle phases.
Time in range was highest during the early follicular phase and progressively decreased toward the luteal phase.
Time in range by menstrual-cycle phase
| Cycle phase | TIR, 70–180 mg/dL |
|---|---|
| Early follicular | 78.9% |
| Late follicular | 77.8% |
| Periovulatory | 77.7% |
| Early luteal | 76.8% |
| Midluteal | 76.8% |
| Late luteal | 75.7% |
The overall phase-related difference was statistically significant (P = .004).
Thus, compared with the early follicular phase, glycemic control was less favorable during the luteal phase.
2. Time in tight range also decreased
A similar pattern was observed when the researchers used the narrower glucose target of 70–140 mg/dL.
Time in tight range
| Cycle phase | TITR, 70–140 mg/dL |
|---|---|
| Early follicular | 54.9% |
| Late follicular | 53.6% |
| Periovulatory | 52.4% |
| Early luteal | 51.8% |
| Midluteal | 51.9% |
| Late luteal | 51.3% |
The variation across the cycle was statistically significant (P < .001).
The decline in tight-range control was therefore more pronounced than the change in the broader 70–180 mg/dL target.
3. More insulin was required during the luteal phase
The researchers observed that total daily insulin requirements increased during the luteal phase.
Carbohydrate intake also increased during this part of the cycle.
The combination of:
- greater carbohydrate intake,
- higher insulin requirements,
- higher mean glucose levels, and
- lower TIR
suggests that the additional insulin delivered during the luteal phase did not completely compensate for the accompanying reduction in insulin sensitivity.
4. Insulin sensitivity changed across the menstrual cycle
One of the most important findings was the modeled change in insulin sensitivity.
Using a hierarchical Bayesian state-space model, investigators estimated a latent insulin-sensitivity parameter from CGM and insulin-delivery data.
Population-level insulin sensitivity
| Menstrual phase | Relative insulin sensitivity |
|---|---|
| Early follicular | +2.6% |
| Midluteal | −2.6% |
The credible interval for the early follicular estimate was 0.3% to 5.0%, while the midluteal estimate had a credible interval of −5.2% to −0.1%.
This represents an approximately 5.2-percentage-point difference in modeled insulin sensitivity between the early follicular and midluteal phases at the population level.
The important point is not that every participant experienced exactly a 5.2% change, but that the population-level model identified a consistent shift toward lower insulin sensitivity during the luteal phase.
5. Most participants followed the overall pattern—but not everyone
Individual responses varied substantially.
Approximately 84.7% of participants showed a pattern consistent with the overall population finding:
Higher insulin sensitivity during the early follicular/periovulatory period → lower insulin sensitivity during the midluteal phase.
However, the remaining participants did not demonstrate the same pattern.
This individual variability is clinically important because it means that automatically increasing insulin doses for every person during the luteal phase could lead to inappropriate insulin delivery in some individuals.
6. Changes in time above and below range
The study also found phase-related changes in glucose excursions.
During the early follicular phase, time below range was higher relative to the individual’s cycle mean. This subsequently declined during the luteal phase.
Conversely, time above range increased during the luteal phase.
In the supplied study report:
| Glucose measure | Early follicular | Later cycle |
|---|---|---|
| Time below range | Above cycle average | Lower during luteal phase |
| Time above range | Below cycle average | Increased, peaking around midluteal phase |
This pattern is consistent with the overall finding of greater insulin sensitivity earlier in the cycle and reduced sensitivity later.
7. The effect was not explained simply by contraception or PCOS
Subgroup analyses examined participants according to hormonal contraception use and PCOS or other cycle-related conditions.
The general pattern of:
higher insulin sensitivity in the early follicular phase → lower sensitivity around the midluteal phase
remained present, although estimates were less precise in these smaller subgroups.
This suggests that inclusion of participants using hormonal contraception did not substantially account for the main population-level finding.
Researchers’ perspective
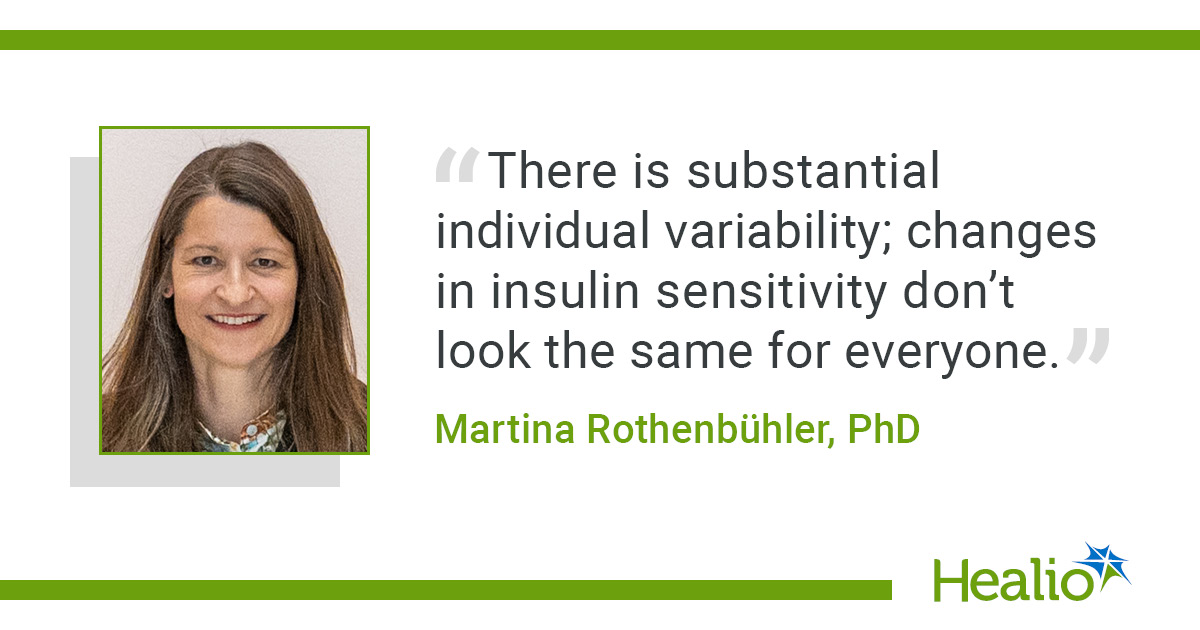
Martina Rothenbühler, PhD, emphasized that insulin requirements, glucose levels and carbohydrate intake differed according to menstrual-cycle phase.
She explained:
“There is substantial individual variability; changes in insulin sensitivity don’t look the same for everyone.”
She also highlighted a potential limitation of current automated insulin-delivery algorithms:
“Rigid learning windows of automated insulin delivery algorithms might not make sense with regard to fast or important changes in hormones.”
The researchers therefore suggest that future AID systems may need to recognize menstrual-cycle-related physiological changes when estimating insulin requirements.
Clinical significance
Menstrual cycle may be an important variable in T1D management
For menstruating individuals with T1D, changes in insulin sensitivity across the menstrual cycle may contribute to fluctuations in:
- insulin requirements,
- mean glucose,
- time in range,
- time in tight range,
- time above range, and
- carbohydrate requirements.
This provides a physiological explanation for why some individuals notice predictable changes in glucose control at particular points in their menstrual cycle.
AID systems may need greater personalization
Current AID systems are designed to continuously adjust insulin delivery in response to glucose patterns.
However, the study suggests that the underlying insulin sensitivity of an individual may change according to hormonal phase.
A future algorithm could potentially incorporate:
CGM data + insulin requirements + menstrual-cycle phase + individual historical response
rather than relying exclusively on recent glucose data.
However, such an approach would need to be validated prospectively before being incorporated into routine clinical practice.
Why individual variability is important
The study does not show that every woman with T1D should increase insulin during the luteal phase.
Instead, the findings indicate that:
Many—but not all—individuals experience reduced insulin sensitivity during the luteal phase.
Therefore, individualized pattern recognition is likely to be more appropriate than applying a universal menstrual-cycle insulin adjustment.
Any insulin-dose modification should be individualized and undertaken with appropriate diabetes-management guidance.
Limitations
1. Observational study
This was an observational study using real-world data rather than a randomized intervention trial.
Therefore, it can demonstrate associations between menstrual-cycle phase and glucose/insulin patterns but cannot establish causation.
2. Self-reported menstrual-cycle data
Participants self-tracked their menstrual cycles. This introduces the possibility of inaccuracies in determining cycle phase.
3. Self-selected population
Participants voluntarily contributed their data, which may introduce selection bias.
Individuals who were particularly interested in menstrual-cycle-related glucose changes may have been more likely to participate.
4. Heterogeneity of AID systems
Participants used different AID systems, including commercial and open-source systems. Algorithm characteristics may therefore have differed between individuals.
5. Individual variability
Although a large majority showed the overall population pattern, approximately 15% did not demonstrate the same direction of change.
This limits the applicability of a universal menstrual-cycle-based insulin adjustment.
6. Limited representation
The study focused on menstruating individuals with T1D and regular cycles. The findings may not directly apply to people with irregular cycles, menopause, pregnancy or other endocrine conditions.
7. Observational estimates of insulin sensitivity
The insulin-sensitivity measure was model-derived, rather than directly measured using a gold-standard metabolic clamp technique. The findings should therefore be interpreted as modeled physiological estimates.
What doctors should know
- Menstrual-cycle phase can be associated with meaningful changes in glucose control and insulin requirements in menstruating individuals with T1D.
- In this study, TIR declined from the early follicular phase toward the luteal phase.
- Time in tight range showed a similar but somewhat larger deterioration.
- Total daily insulin requirements and carbohydrate intake increased during the luteal phase.
- Population-level modeled insulin sensitivity was approximately 2.6% higher than average during the early follicular phase and approximately 2.6% lower during the midluteal phase.
- Approximately 84.7% of participants showed the overall population pattern.
- Substantial individual variability remains, meaning that a uniform insulin adjustment based solely on menstrual-cycle phase is unlikely to be appropriate.
- Clinicians should consider discussing menstrual-cycle-related glucose patterns with menstruating patients with T1D.
- AID manufacturers may need to consider hormonal-cycle information when developing future adaptive algorithms.
- The study does not establish a specific insulin dose adjustment that should be applied during any particular menstrual phase.
Practical clinical interpretation
A useful way of conceptualizing the findings is:
Early follicular phase
↓
Higher insulin sensitivity
↓
Lower insulin requirements
↓
Better TIR
Transition toward luteal phase
↓
Reduced insulin sensitivity
↓
Higher insulin requirements
↓
Higher mean glucose
↓
Lower TIR / higher time above range
This pattern was observed at the population level but was not universal among individuals.
Bottom line
A real-world observational study published in Diabetes Care found that menstrual-cycle phase was associated with systematic changes in insulin sensitivity, insulin requirements and glycemic control among menstruating adults with type 1 diabetes using automated insulin delivery systems.
Across 380 menstrual cycles contributed by 77 participants, insulin sensitivity was highest during the early follicular phase and lowest around the midluteal phase. TIR and tight-range glucose control also declined during the luteal phase, while insulin requirements and carbohydrate intake increased.
The findings highlight a potentially important limitation of current AID systems: hormonal changes can alter insulin requirements in ways that may not be fully captured by algorithms trained primarily on recent glucose and insulin-delivery patterns.
However, the substantial variability between individuals means that these findings should support personalized monitoring rather than routine, universal insulin-dose changes based solely on menstrual-cycle phase.
Original research / DOI
Hossmann S, Friedman M, Lizoain A, et al. Effects of Menstrual Cycle on Insulin Sensitivity in Type 1 Diabetes: An Observational Study of Individuals Using an Automated Insulin Delivery System. Diabetes Care. 2026;49(9):1673-1680.
DOI: 10.2337/dc26-0692
PMID: 42482329
PMCID: PMC13493352.
The article was published in the September 2026 issue of Diabetes Care.